Errors
Every kind of problem once, sorted by how many people it reached.
The Errors page groups error and critical events by their area and event name, so each
kind of problem appears once. The heading sums it up: how many kinds of problem, how many are
new in the range, and how many people they reached.
Pick the last 24 hours, 7 days (the default) or 30 days.
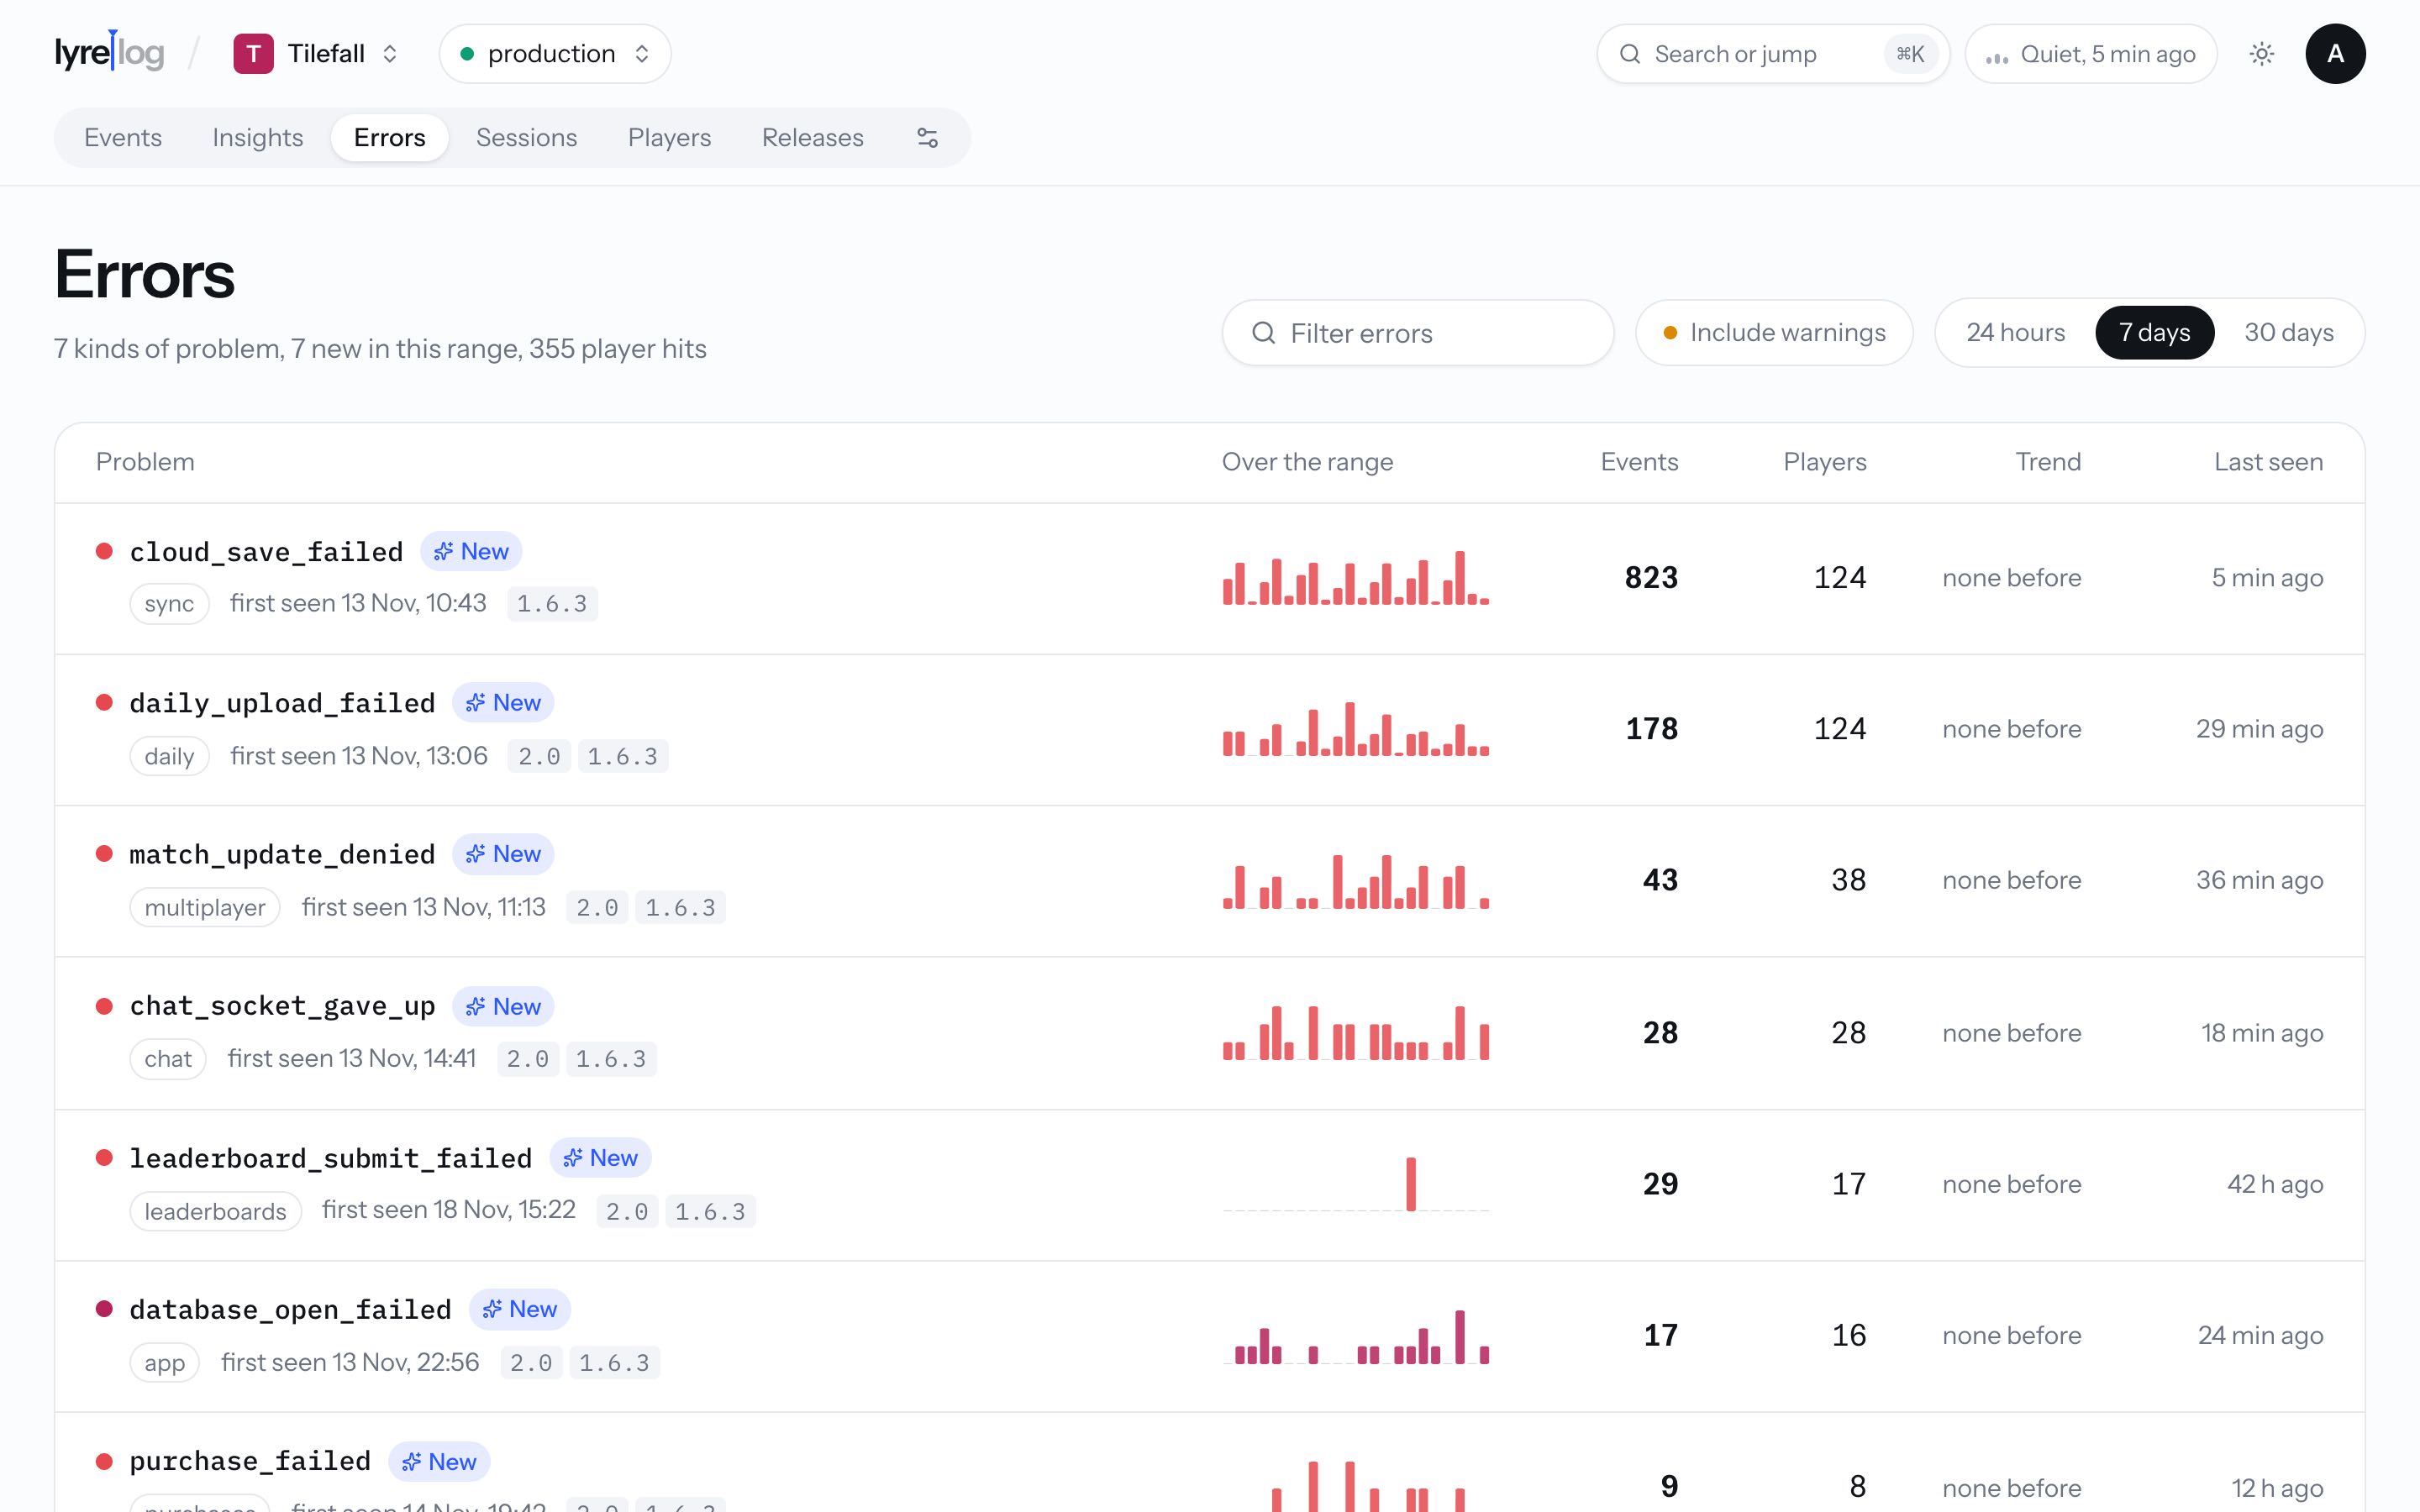
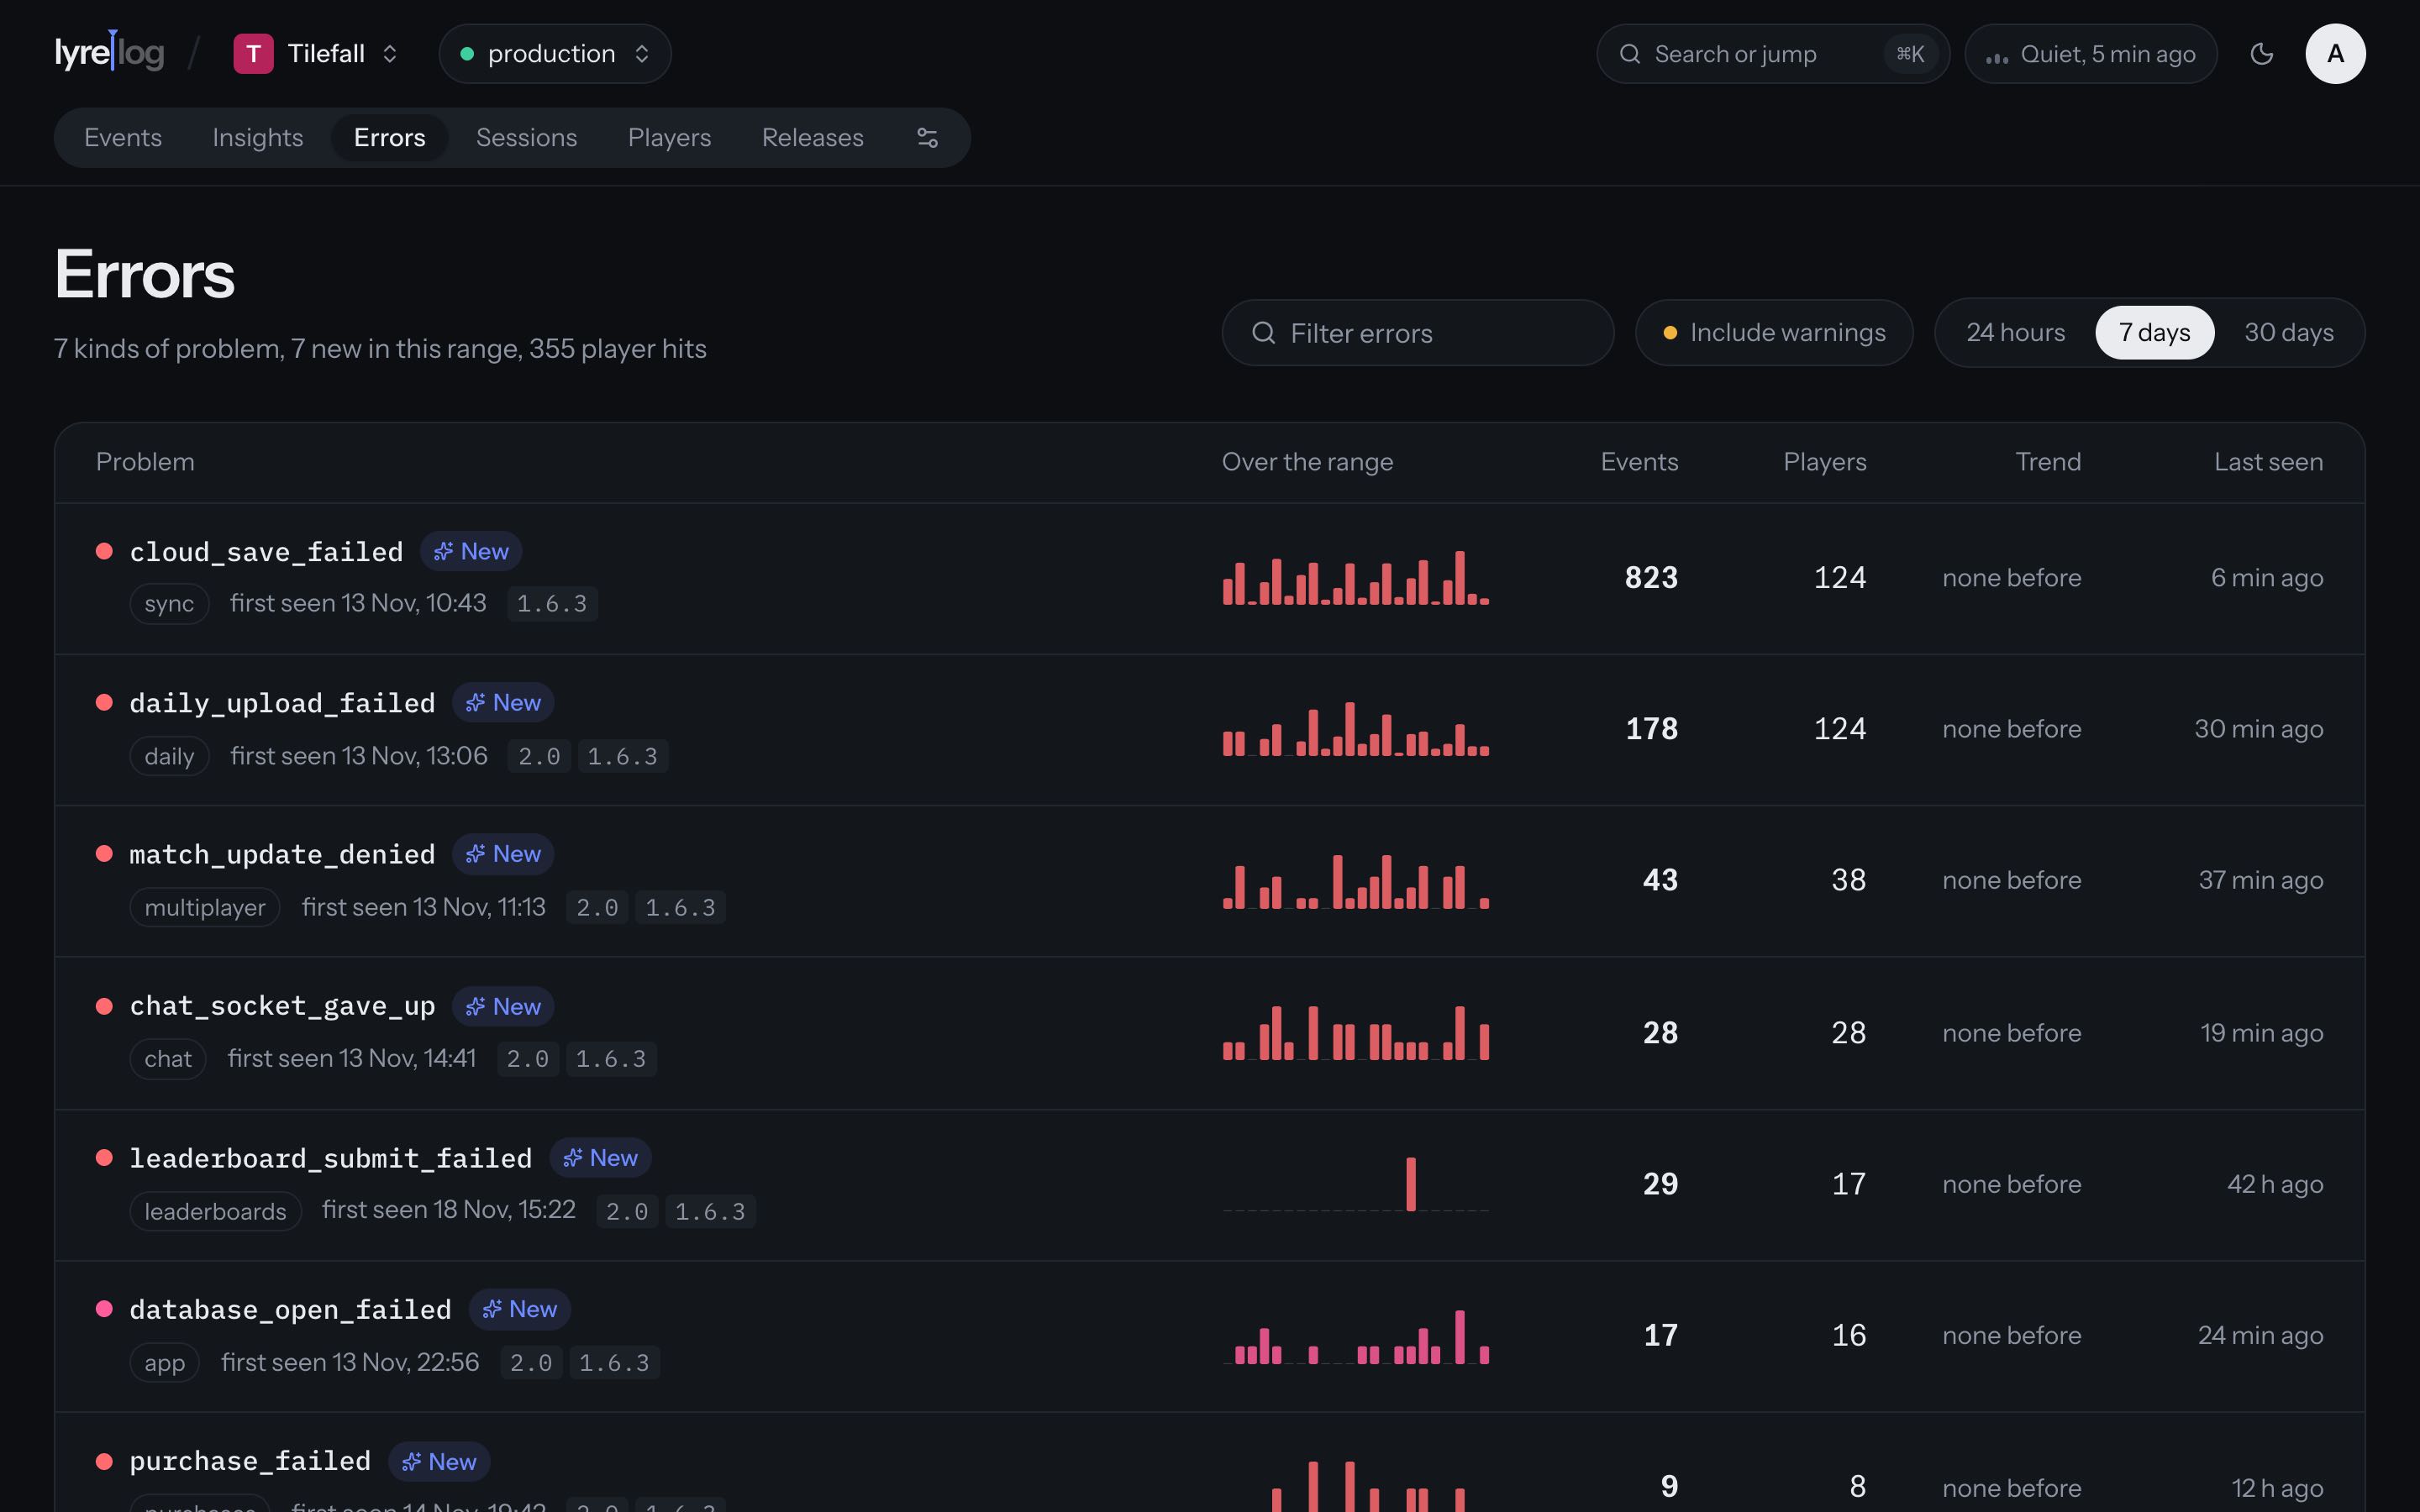
Each problem
- Its name, its area, when it was first seen, and the app versions it appears in. Problems first seen inside the range are marked New.
- Over the range: bars of how often it happened.
- Events and Users (your project's word): how many of each it reached.
- Trend: the change against the period just before, as a percentage. Below 10 events before, it says how many there were instead ("none before", "4 before").
- Last seen.
The list is sorted by how many people each problem reached.
Using it
- Include warnings adds
warningevents. - Filter errors narrows the list by area or name.
- Click a problem's name to see its events in the explorer.
- Play back the latest opens the person who hit it most recently and plays back that session from the error. See Sessions and playback.
Crash and hang reports from the Swift SDK show up here as
app_crashed and app_hung in the diagnostics area. Crashes from the
Android SDK are app_crashed in the same area, so both
platforms' crashes sit together. The React Native
and Flutter SDKs send the native SDKs' crash reports too,
and React Native adds fatal JavaScript errors as app_crashed beside them. Errors nobody caught
that didn't end the app (an unhandled promise rejection, a Dart error, an uncaught exception on a
JVM thread) are exception events with handled: false.