Insights
Trends, values, failure rates and funnels, built for the questions logs answer.
Insights lean to what logs measure: how often something happens, how long it takes, how often it fails. Product funnels for marketing belong in a product analytics tool; here they're for flows that break.
Choose Trends, Rates or Funnels at the top, and a range of 24 hours, 7 days (the default) or 30 days. Like every page about events, Insights follows the environment and platform in the top bar.
Every chart leaves out the bucket still in progress, so the last point never looks like a drop. The whole builder lives in the URL, so any chart can be shared.
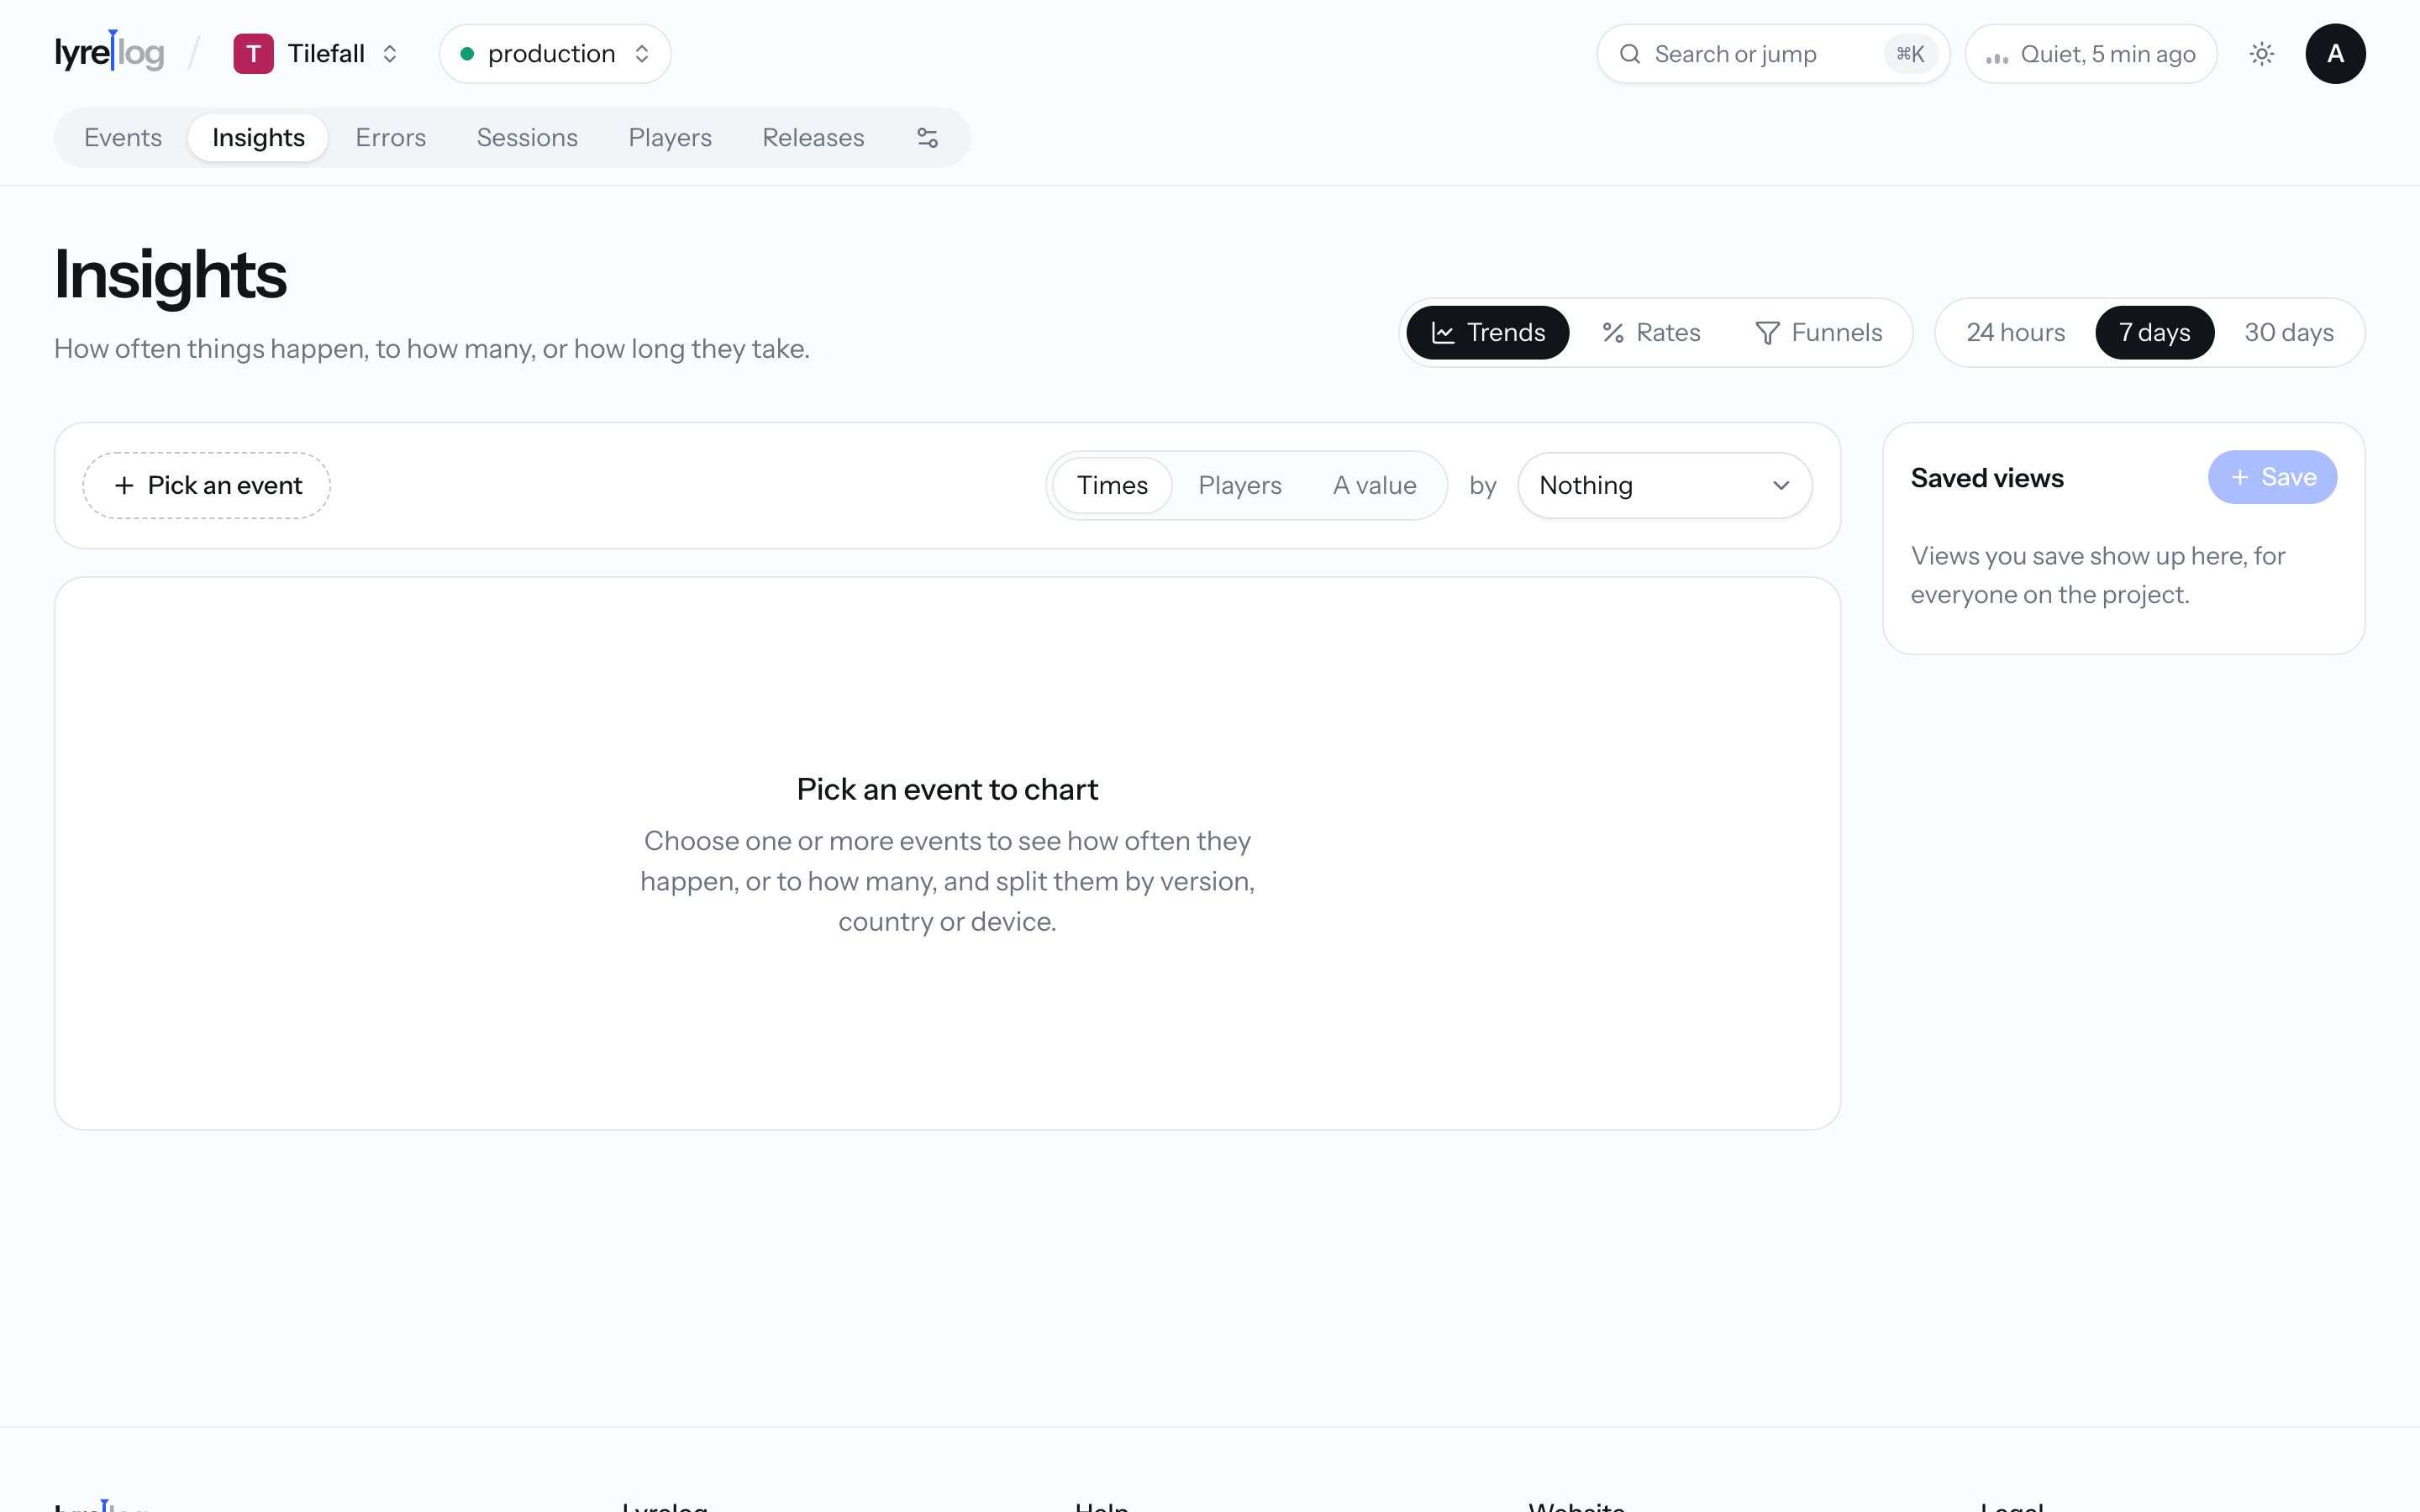
Trends
How often things happen, to how many, or how long they take.
- Add event: one or more events to chart.
- Choose what to count:
- Times: how many events.
- Users (your project's word): how many different people.
- A value: a statistic of a numeric attribute.
- Break down by app version, country, OS version, device, area or locale. The 8 biggest groups are named; the rest add up to "Other".
Values
With A value, pick the Statistic (Average, Median, p90, p95, p99 or Highest) and the
Attribute, for example the p95 of latency_ms. Events without that attribute are skipped,
and a bucket with none is drawn as a gap. Units come from the attribute's name: _ms is
milliseconds, seconds is seconds, bytes is bytes.
Log durations and sizes as numbers (latency_ms: 412) to measure them.
Rates
What share of attempts fail, over time and by version.
Pick What failed (leaderboard_submit_failed) and What was tried (leaderboard_submit).
The chart shows failures over attempts in each bucket, and can be broken down like a trend.
Funnels
How many get from one step to the next.
Add two to eight steps. A funnel follows each person (by user_id) through the steps in order,
within Time to finish (5 minutes, 1 hour, 1 day or 7 days), and shows how many reach each one
and the median time between steps. Events without a user_id don't count. Reorder steps with
Move earlier and Move later.
Saved views
Save what's on screen keeps the current chart or funnel under a name. Saved views show up for everyone on the project. Click one to open it, or hover it and click the bin to delete it.